immunization coverage have experienced an age shift of diphtheria cases towards older children and adolescents [8-10]. This is because there has been > 90% coverage in birth cohorts since 2014 but gaps in booster dose coverage are widely prevalent. This has resulted in waning immunity following the primary series of diphtheria vaccinations [11,12]. Lack of awareness among the primary care physicians leading to a delay in clinical diagnosis can also be a possible reason for delayed reporting and management of cases [13]. Studies have reported that national data on coverage of boosters is not routinely collected and people often remain partially immunized [1,14-17]. To add more fuel to the fire, certain faith-based organizations consider vaccines as ‘interventions by westerners’ to destroy certain communities and taking them would lead to impotence [15,17]. Persistence of these factors undermine the efforts of the government to yield any fruitful results regarding elimination of vaccine preventable diseases.

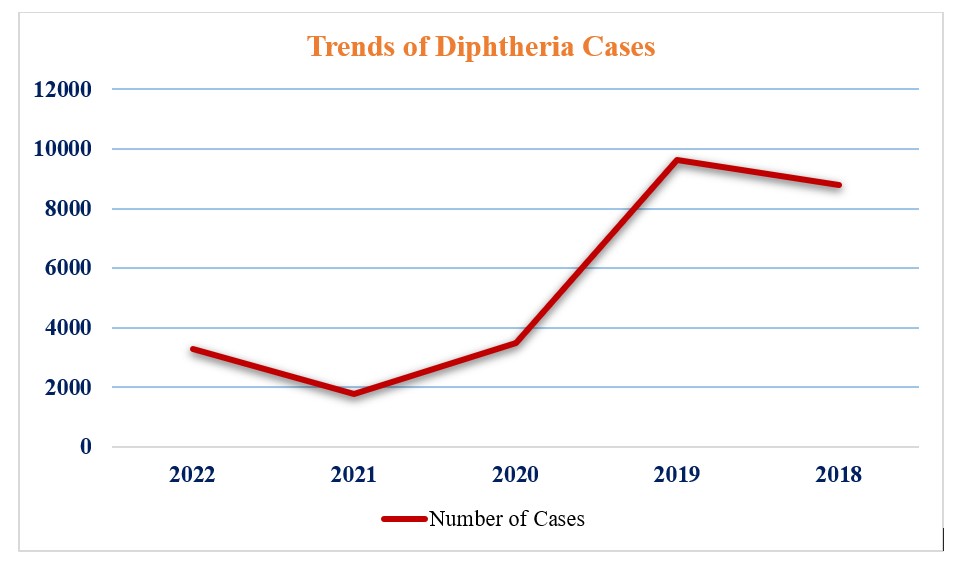
Figure 1: Showing graphical representation of diphtheria cases over the last few years as reported by Global Health Observatory Data Repository, WHO [7]
Experts around the world have continuously warned regarding the growing number of antimicrobial genes in this bacterium making it resistant to a number of antibiotics [18]. Disrupted childhood vaccination schedules due to the COVID-19 pandemic have made the situation worse. Studies around the world have shown a resurgence of diphtheria cases post the pandemic in countries such as India, Peru, Pakistan, and Nigeria [19].
The 2016 Kerala outbreak in India showed that about 79% of the cases occurred in persons more than 10 years of age. As evidenced by the diphtheria epidemics in South America and Eastern Europe, immunity is attenuated after a few years of the primary series of childhood vaccinations. These regions eventually shifted to Td (tetanus and adult diphtheria) vaccinations for older children, adolescents, and pregnant women which resulted in a marked decrease in diphtheria cases [20].
Table 1: Showing data on Indian states exhibiting maximum cases and deaths due to diphtheria in the past few years [1]
| States/ UT | Year | Male | Female | Total | |||
|---|---|---|---|---|---|---|---|
| Cases | Deaths | Cases | Deaths | Cases | Deaths | Cases | Deaths |
| West Bengal | 2021 | 1548 | 0 | 679 | 0 | 2227 | 0 |
| Telangana | 2021 | 43 | 0 | 62 | 47 | 105 | 47 |
| Delhi | 2020 | 72 | 8 | 64 | 7 | 136 | 15 |
| Telangana | 2020 | 125 | 0 | 129 | 0 | 254 | 0 |
| Gujrat | 2019 | 219 | 0 | 223 | 0 | 442 | 0 |
| Delhi | 2019 | 232 | 25 | 170 | 16 | 402 | 41 |
