THE EVIDENCE www.evidencejournals.com
Research Article Public Health`
Cite this Article
Maheshwari V, Gupta PC, Serhan HA, Aggarwal D, Ram S, Gopi K, Bajwa N, Prevalence and determinants of vision problems among community-dwelling older adults with diabetes: evidence from longitudinal ageing study in India (2017-18). The Evi. 2024:2(2):1-. DOI:10.61505/evidence.2024.2.1.61
Available From
https://the.evidencejournals.com/index.php/j/article/view/61

Received: 2024-05-18
Accepted: 2024-06-23
Published: 2024-06-29

Evidence in Context

• 66.70% of older adults with diabetes in India report vision problems. • Increased risk of vision issues correlates with older age, higher education, widowed or divorced status, and higher economic status. • Obesity and comorbidities significantly raise the likelihood of vision problems. • Diabetes elevates the risk of vision issues by 13.0%. • The findings stress the necessity of integrating eye care within diabetes management programs.

To view Article

Prevalence and determinants of vision problems among community-dwelling older adults with diabetes: evidence from longitudinal ageing study in India (2017-18)

Vansh Maheshwari1†, Parul Chawla Gupta2†, Hashem Abu Serhan3*, Dipanshu Aggarwal4, Sumit Ram5, Kumbha Gopi6, Neha Bajwa7

1 Evidence Synthesis Lab, Kolkata, India.

2 Department of Ophthalmology, Postgraduate Institute of Medical Education and Research, Chandigarh, India.

3 Department of Ophthalmology, Hamad Medical Corporation, Doha, Qatar.

4 Department of Oral Pathology and Microbiology, Shree Bankey Bihari Dental College, Uttar Pradesh, India.

5 Department of Geography, Banaras Hindu University, Varanasi, India.

6 Department of Epidemiology, South Asia Field Epidemiology and Technology Network Safetynet National Centre for Disease Control, Delhi, India.

7 University Centre of Excellence in Research Institute, Baba Farid University of Health Sciences, Faridkot, India.

*Correspondence: habuserhan@hamad.qa

† Equally contributed

Abstract

Background: This study aimed to examine the prevalence and determinants of vision problems among older adults with diabetes (DM) in India, shedding light on a significant public health issue that mirrors global concerns. Understanding the relationship between diabetes and vision impairment within this demographic is crucial for developing effective interventions.

Methods: Drawing upon cross-sectional data derived from the Longitudinal Aging Study in India (LASI) Wave 1 (2017-2018), an examination was conducted on a cohort of 8,564 individuals aged 45 years and older who had been diagnosed with diabetes. The study employed a multistage stratified sample design, covering all Indian states and union territories. Vision problems were assessed through self-reported data, and a range of sociodemographic and health-related factors were examined as potential determinants. Statistical analysis included descriptive statistics, chi-square tests, multivariable logistic regression, and propensity score matching (PSM) to explore associations and causality.

Results: The weighted prevalence of vision problems among individuals with DM was 66.70%. Factors significantly associated with an increased likelihood of vision problems included older age, higher educational attainment, being widowed/divorced, higher economic status, and the presence of comorbidities. PSM revealed a 13.0% average increase in the risk of vision problems among patients with DM, indicating a substantial impact of diabetes on vision health.

Conclusion: Nearly two-thirds of older adults with DM in India experience vision problems, underlining the urgent need for integrated eye care in diabetes management programs. Addressing the identified determinants through targeted interventions could substantially reduce the vision impairment burden in this vulnerable population, with implications for healthcare planning and policy both in India and globally.


Keywords: Vision problems, diabetes, older adults, cross-sectional, LASI, India

© 2024 The author(s) and Published by the Evidence Journals. This is an open access article under the terms of the Creative Commons Attribution License, which permits use, distribution and reproduction in any medium, provided the original work is properly cited.

Introduction

Vision impairments pose a substantial burden on global public health, impacting numerous individuals across the globe. This burden is particularly pronounced among older adults [1], a population at increased risk of both visual impairment and chronic conditions such as diabetes (DM). Diabetes-associated eye diseases, such as diabetic retinopathy, cataract, and glaucoma, stand as prominent factors contributing to visual impairment and loss of vision within this particular population [2, 3]. Globally, the prevalence of vision problems in the aging population has been escalating [4], mirroring the trends seen in the rising rates of diabetes. World Health Organization (WHO) has stated that diabetes affects more than 422 million individuals across the globe [5], with the majority residing in low- and middle-income countries (LMICs). Diabetic retinopathy alone is estimated to affect approximately one-third of diabetic individuals [6], making it one of the primary reasons for preventable visual impairment in individuals of working age. In India, the scenario is particularly concerning due to the dual burden of a rapidly aging population [7] and an escalating diabetes epidemic [8]. About 17% of the individuals with diabetes have been found to have diabetic retinopathy as per a national survey in 2015-2019 [9].

Risk factors for vision problems in older adults with diabetes are multifaceted, encompassing both modifiable and non-modifiable elements. Key risk factors include the duration of diabetes, inadequate management of blood sugar levels, high blood pressure, abnormal levels of lipids in the blood, and tobacco use [10, 11]. Additionally, genetic predispositions and environmental factors also play critical roles in the development and progression of diabetes-related eye diseases [12, 13]. Identifying and understanding these determinants are crucial for the early detection and management of vision problems in this vulnerable population.

Evidence from systematic reviews and meta-analyses further highlights the significant association between diabetes and the risk of developing vision problems [14]. Intensive glycaemic control and management of blood pressure and lipids can significantly reduce the risk of diabetic retinopathy and other vision impairments [15, 16]. Furthermore, research has also shed light on the socioeconomic impacts of vision impairment, including decreased independence, reduced quality of life, and increased healthcare costs [17, 18]. These findings emphasize the need for comprehensive eye care services as part of diabetes management programs, particularly for older adults.

This study examines the prevalence and determinants of vision problems among older adults with diabetes in India, using data from the Longitudinal Ageing Study in India (2017-18). The research addresses a significant gap by focusing on community-dwelling individuals, unlike previous hospital-based studies. As diabetes and its complications, including vision impairment, increase with the aging global and Indian populations, understanding these issues within the Indian context is essential for creating effective, culturally, and resource-appropriate interventions. This work seeks to offer insights for policy, healthcare planning, and community interventions to alleviate vision problems among this demographic, both in India and globally.

Methods

Study design and data source

This research made use of data derived from the Longitudinal Aging Study in India (LASI) Wave 1, a nationally representative survey conducted in 2017-2018. LASI represents a collaborative initiative involving the International Institute for Population Sciences (IIPS), Harvard T.H. Chan School of Public Health, University of Southern California, and the National Institute on Aging (NIA), which aims to provide comprehensive information on the health and well-being of India's aging population.

Analytic sample

The sample for this study consisted of 66606 older adults aged 45 years and above who participated in LASI Wave 1. Individuals with diabetes were specifically identified within this sample for the analysis. The survey employed a multistage stratified sample design to ensure national representation. It covered all Indian states and union territories, both in urban and rural areas.

Data collection

LASI Wave 1 data collection involved face-to-face interviews conducted by trained interviewers. These interviews took place at respondents' households and covered various aspects of health, socio-economic status, and demographics. More details about the survey instruments, data collection and procedures can be found elsewhere [19]. For this study, relevant variables were extracted from the dataset, including information on vision problems, diabetes status, and potential determinants.

Outcome variable

The primary focus of this study was the prevalence of visual impairments in elderly individuals diagnosed with diabetes. Vision problems were assessed based on the dichotomous (yes or no) self-reported question “Have you ever been diagnosed with any eye or vision problem or condition, including ordinary near-sightedness or farsightedness?”.

Explanatory variables

The study considered sociodemographic factors across various categories, including age (grouped as 45-59, 60-75, and >75 years), sex (male and female), education level (no education or less than primary, primary complete, secondary, higher and, graduate and above education), marital status (currently married, widowed/divorced/others, and never married), residence (urban and rural), and religion (Hindu, Islam and others). Monthly per capita expenditure (MPCE) was constructed using Principal Component Analysis (PCA) on a range of asset ownership indicators and household characteristics to generate a continuous score reflecting each household's economic status. This score was then divided into 5 quintiles, ranging from poorest to richest economic groups, to facilitate analyses.

Health-related factors were thoroughly investigated as well, with several key indicators measured. Body Mass Index (BMI) was calculated from measured height and weight. BMI was categorised using the Asian BMI classification system [20] as underweight (<18.5 kg/m²), normal (18.5-22.9 kg/m²), overweight (23-24.9 kg/m²), and obese (≥25 kg/m²). Tobacco (smoking or smokeless) and alcohol use were included based on participants’ self-reporting as yes or no. The presence of chronic conditions such as hypertension, heart disease, cancer, lung disease, stroke, arthritis, neurological disorders, and high cholesterol was also considered, categorized as having none or one or more of such conditions.

Statistical analysis

Descriptive statistics were employed in order to provide a concise summary of the attributes of the study cohort, encompassing the computation of means and standard deviations for continuous variables, as well as the determination of frequencies and percentages for categorical variables. The prevalence of vision problems among older adults with diabetes was calculated with a 95% confidence interval. Bivariate analysis was conducted using chi-square tests to examine the association between each explanatory variable and the outcome variable (vision problems among older adults with diabetes). To further explore the determinants of vision problems among this population, A model of multivariable logistic regression was used for data modelling. Variables that showed significant correlations in the univariate examination were incorporated into the regression model. Adjusted odds ratios (ORs) and their corresponding 95% confidence intervals were computed in order to evaluate the magnitude and orientation of these relationships while considering possible confounding variables.

Additionally, to evaluate the effect of DM on individuals with vision problems, we applied propensity score matching (PSM). In this approach, each case was individually matched to a control, considering DM as the treatment group and various covariates as baseline characteristics. Impact of DM on vision problems was calculated, taking into account the covariates and potential biases linked to the allocation of subjects in the treatment and control groups.

All analyses were carried out using survey weights in order to consider the complex survey structure of LASI Wave 1 and to ensure national representativeness. Statistical significance was set at P<0.05, and Stata version 15.1 (StataCorp, USA) was used for data management and analyses.

Results

The study included 8564 participants with DM (Table 1). The age distribution of participants indicated a higher prevalence of DM in the older age groups, with 14.92% of participants aged 60-75 and 11.27% of participants older than 75 years. The gender distribution was fairly balanced, with males representing 12.51% and females 12.20% of the sample. Regarding educational attainment, participants with higher levels of education showed a greater prevalence of diabetes, with those holding graduate degrees and above accounting for 23.08% of the cases. Religious denominations revealed a higher prevalence among Muslims at 16.41%, compared to Hindus at 11.69% and other religions at 13.56%. Economic status, as indicated by the MPCE Quintile, showed that individuals in the richest quintile had the highest prevalence of diabetes at 19.6%. The place of residence was a significant factor, with urban residents showing a higher prevalence of diabetes at 21.53% compared to rural residents at 8.16%. Body Mass Index (BMI) categories indicated a strong correlation with diabetes prevalence, particularly among overweight (15.07%) and obese (21.69%) participants. Lifestyle factors such as tobacco and alcohol consumption showed varied effects, with non-users of tobacco and alcohol exhibiting higher diabetes prevalences at 14.53% and 12.79%, respectively. Participants with additional comorbidities demonstrated a significantly higher prevalence of diabetes, at 21.30% for those with one or more comorbid conditions. The weighted prevalence of vision problems among individuals with DM was found to be 66.70% (95% CI: 63.59, 69.67).

Table 1: Sociodemographic and lifestyle characteristics of participants having diabetes (N = 8564)

Characteristics

n (weighted %)

Age

45-59

3630 (10.42)

60-75

4185 (14.92)

>75

749 (11.27)

Sex

Male

4122 (12.51)

Female

4442 (12.20)

Education level

No education or less than primary

1011 (13.07)

Primary complete

1333 (14.77)

Secondary

2169 (18.21)

Higher

669 (18.12)

Graduate and above

749 (23.08)

Marital status

Never married

70 (5.534)

Currently married

6412 (12.36)

Widowed/Divorced/Separated/Deserted

2082 (12.62)

Religious Denomination

Hinduism

6018 (11.69)

Islam

1270 (16.41)

Others

1276 (13.56)

MPCE Quintile

Poorest

1158 (8.436)

Poorer

1401 (9.113)

Middle

1665 (11.09)

Richer

1982 (14.66)

Richest

2358 (19.6)

Residence

Rural

3747 (8.16)

Urban

4817 (21.53)

BMI

Underweight (<18.5)

430 (3.658)

Normal (18.5-22.9)

1991 (8.431)

Overweight (23-24.9)

1436 (15.07)

Obese (≥25)

3789 (21.69)

Ever smoked or used smokeless tobacco

No

6246 (14.53)

Yes

2250 (8.54)

Ever consumed Alcohol

No

7258 (12.79)

Yes

1247 (9.64)

Additional comorbidities

None

2273 (5.43)

One or more

6291 (21.30)

Abbreviations: MPCE: monthly per capita expenditure, BMI: body mass index

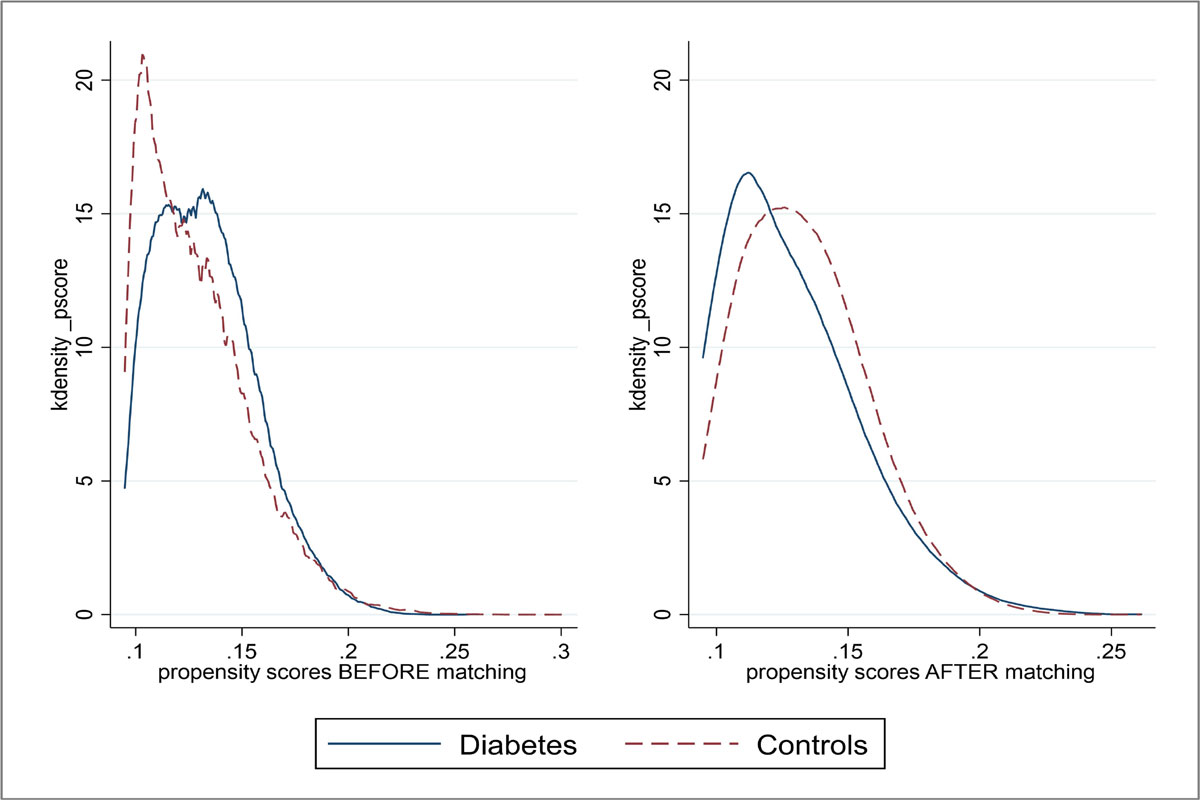
Table 2 presents the findings derived from propensity score matching. The initial comparison, or the raw estimate without matching, is termed as the unmatched sample estimate, serving as a baseline. The findings reveal that older adults diagnosed with DM showed a 23.0% increased chance of encountering vision problems compared to their non-DM counterparts. The Average Treatment Effect (ATE) was 0.69 for the treated group and 0.52 for the control group. This suggests that the absence of DM could have potentially led to a decrease in the prevalence of vision problems among patients who currently have DM. Further, the Average Treatment Effect on the Untreated (ATU) produced results of 0.46 for the treated group and 0.58 for the control group. This indicates a projected increase in the risk of vision problems by 12.0% should individuals without DM develop this condition. The overall Average Treatment Effect (ATE) was calculated at 0.13, denoting an average increase in vision problem risk by 13.0% in patients with DM. The covariate balance plot in Figure 1, both before and after the match, validates the impartiality and reliability of the estimated treatment effects in the treatment and control groups.

Table 2: Propensity Score Matched assessment of the effect of diabetes on vision problems

Outcome

Sample

Treated

Control

Difference

Standard error (SE)

T-stat

Vision problems

Unmatched

0.69

0.46

0.23

0.01

40.95

ATT

0.69

0.52

0.17

0.06

2.80

ATU

0.46

0.58

0.12

-

-

ATE

-

-

0.13

-

-

evi-02-02-61-01.jpg

Figure 1: Balance plot from propensity score matching taking vision problems as the outcome

Table 3 presents the prevalence and determinants of vision problems in people previously diagnosed with DM. In participants with DM, those aged 60-75 had significantly higher odds of having vision problems (aOR = 1.47, 95% CI: 1.12, 1.94) compared to the 45-59 age group. Further, those with secondary education (aOR = 1.72, 95% CI: 1.05, 2.82), widowed/divorced/others (aOR = 1.52, 95% CI: 1.01, 2.29), and richer MPCE quintile (aOR = 1.80, 95% CI: 1.18, 2.74) had significantly higher odds of having vision problems than their respective counterparts. For lifestyle characteristics, overweight BMI (aOR = 2.02, 95% CI: 1.17, 3.49), obese BMI (aOR = 1.70, 95% CI: 1.01, 2.86), and one or more additional comorbidities (aOR = 1.30, 95% CI: 1.02, 1.65) were significantly associated with higher odds of having vision problems among individuals with DM.

Table 3: Distribution of vision and hearing problems and its determinants among participants with previously diagnosed diabetes (N = 8557)

Characteristics

Vision problems absent

(n = 2644)

n (weighted %)

Vision problems present

(n = 5913)

n (weighted %)

Adjusted OR

P-value

95% CI

Age

45-59

1335 (39.52)

2292 (60.48)

1.00

60-75

1136 (28.72)

3045 (71.28)

1.47

0.01

1.12

1.94

>75

173 (29.14)

576 (70.86)

1.81

0.12

0.87

3.78

Sex

Male

1265 (33.52)

2855 (66.48)

1.00

Female

1379 (33.11)

3058 (66.89)

1.13

0.48

0.81

1.58

Education level

No education or less than primary

318 (32.34)

693 (67.66)

1.06

0.82

0.63

1.81

Primary complete

394 (34.6)

937 (65.4)

0.88

0.66

0.48

1.59

Secondary

546 (23.13)

1620 (76.87)

1.72

0.03

1.05

2.82

Higher

168 (31.05)

501 (68.95)

1.07

0.84

0.55

2.07

Graduate and above

187 (30.23)

562 (69.77)

1.00

Marital status

Currently married

1998 (35.05)

4409 (64.95)

1.00

Never married

26 (49.27)

44 (50.73)

0.74

0.50

0.31

1.76

Widowed/Divorced/Separated/Deserted

620 (28.07)

1460 (71.93)

1.52

0.049

1.01

2.29

Religious Denomination

Hinduism

1916 (35.06)

4099 (64.94)

1.00

Islam

370 (26.47)

897 (73.53)

1.25

0.25

0.86

1.82

Others

358 (28.5)

917 (71.5)

1.09

0.65

0.75

1.58

MPCE Quintile

Poorest

414 (38.47)

743 (61.53)

1.00

Poorer

485 (37.18)

915 (62.82)

1.34

0.17

0.88

2.04

Middle

552 (37.84)

1111 (62.16)

1.08

0.76

0.66

1.75

Richer

557 (27.19)

1424 (72.81)

1.80

0.01

1.18

2.74

Richest

636 (30.65)

1720 (69.35)

1.38

0.21

0.83

2.28

Residence

Rural

1336 (39.69)

2408 (60.31)

1.00

Urban

1308 (27.98)

3505 (72.02)

1.28

0.08

0.97

1.70

BMI

Underweight

171 (44.14)

259 (55.86)

1.00

Normal weight

696 (39.87)

1294 (60.13)

1.19

0.51

0.71

2.02

Overweight

391 (29.37)

1045 (70.63)

2.02

0.01

1.17

3.49

Obese

1086 (31.22)

2703 (68.78)

1.70

0.049

1.01

2.86

Ever smoked or used smokeless tobacco

No

1893 (32.24)

4352 (67.76)

1.00

Yes

736 (36.37)

1514 (63.63)

1.14

0.34

0.87

1.50

Ever consumed Alcohol

No

2258 (33.2)

4999 (66.8)

1.00

Yes

372 (33.9)

875 (66.1)

1.11

0.52

0.81

1.50

Additional comorbidities

None

873 (42.31)

1399 (57.69)

1.00

One or more

1771 (30.32)

4514 (69.68)

1.30

0.03

1.02

1.65

Hosmer-Lemeshow goodness of fit P-value = 0.08

P<0.05, P<0.001

Abbreviations: MPCE: monthly per capita expenditure, BMI: body mass index, OR: odds ratio, CI: confidence interval, Ref: reference

Discussion

The results of this investigation emphasize the significant influence of diabetes (DM) on the frequency of visual impairments in the elderly population of India, a critical issue that reflects broader global trends. The heightened prevalence of vision impairments in this demographic aligns with prior research, emphasizing the intricate relationship between aging, diabetes, and vision health. Our analysis revealed a significant association between DM and an increased likelihood of vision problems, with a weighted prevalence of 66.7% among individuals with DM.

The age-related increase in the prevalence of DM and its associated vision problems is particularly notable. Our findings, showed higher prevalence rates among those aged 60-75 and over 75, mirror global studies that have documented the age-dependent rise in diabetes and diabetic retinopathy [21], blindness among working-age adults is predominantly attributed to the latter cause. The biological processes of aging may exacerbate the susceptibility to diabetes-induced eye conditions [22], such as diabetic retinopathy, cataract, and glaucoma, highlighting the need for age-specific screening and management strategies to mitigate the risk of vision loss in this demographic.

The balanced gender distribution observed in our study suggests that the risk of DM and subsequent vision problems is relatively equal among males and females. This finding diverges from some previous research, which reported gender-specific disparities in diabetes prevalence and its complications [23]. Such differences highlight the importance of considering regional and cultural factors when evaluating diabetes-related health outcomes.

The propensity scores matching analysis provided valuable insights into the causal effects of DM on vision problems, demonstrating a substantial impact of diabetes on vision health. This finding highlights the necessity for early detection and management of diabetes to prevent or mitigate vision impairment [24].

Education level emerged as a significant determinant of vision problems, a finding that might reflect disparities in health literacy and access to healthcare services, where individuals with higher education levels are more likely to be diagnosed with both diabetes and its complications due to better healthcare engagement [25]. However, it also underscores the complex interplay between socioeconomic factors and health outcomes, suggesting that educational interventions aimed at improving diabetes awareness and management could play a crucial role in preventing vision impairment.

Marital status and economic status are other notable factors influencing the risk of vision problems in people with DM. Widowed, divorced, or other non-married individuals showed increased odds of vision impairment, possibly due to reduced social support and financial resources for managing diabetes and its complications [26]. Similarly, individuals from richer economic quintiles exhibited higher odds of vision problems, which might reflect lifestyle factors associated with affluence, such as sedentary behaviour and poor dietary habits that exacerbate the risk of diabetes and its eye-related complications [27, 28].

Further, overweight and obese individuals with DM had significantly higher odds of experiencing vision impairments, highlighting the well-established connection between obesity and diabetes. Obesity contributes to insulin resistance and chronic inflammation [29], which can accelerate the development of diabetic retinopathy and other eye conditions [30]. This evidence reinforces the importance of weight management as a critical component of diabetes care to prevent vision problems [31].

In our study, individuals having one or more chronic conditions alongside DM showed higher odds of vision impairment. This underscores the multifaceted nature of health in older adults with diabetes, where the cumulative effect of multiple chronic conditions can exacerbate the risk of vision problems [32]. Integrated care approaches that address the full spectrum of an individual's health needs are essential for effectively managing the risk of vision impairment in this population.

The socioeconomic impacts of vision impairment further underscore the importance of integrating eye care into diabetes management programs. Our study supports the need for comprehensive eye care services that are accessible to older adults with diabetes, particularly in resource-constrained settings like India. Such services should not only focus on treatment but also on prevention and early detection of vision problems.

Our study has several strengths that contribute to its significance and reliability in the field of public health, particularly in understanding the interplay between diabetes (DM) and vision problems among the elderly population in India. One of the primary strengths lies in its use of data from the LASI, a nationally representative survey. This data source ensures a wide-ranging and comprehensive sample that captures the diversity of the Indian population across different states, urban and rural settings, and socioeconomic statuses. The large sample size of 66,606 older adults, including 8,564 participants with DM, enhances the study's statistical power and the generalizability of its findings to the broader older adult population in India. Furthermore, the study's methodological rigor, including the use of multistage stratified sampling, propensity score matching, and multivariable logistic regression models, adds to the robustness of its conclusions.

Limitations:

One notable limitation is its reliance on self-reported data for both diabetes status and vision problems. This approach may introduce reporting bias, as participants might underreport or overreport their health conditions due to recall errors, stigma, or misunderstanding of their medical diagnoses. The cross-sectional design of the LASI Wave 1 data also limits the ability to infer causality between diabetes and vision problems. While the study employs propensity score matching to estimate the causal effects of DM on vision problems, longitudinal data would provide a more definitive understanding of the temporal relationship between these variables.

Conclusion

This study shows that nearly two in three older adults with DM have some vision problem. It highlights the urgent need for targeted interventions to address the risk factors and determinants of vision impairment in this population. Future research should aim to elucidate the mechanisms underlying the associations observed in this study and explore effective strategies for integrating eye care into existing diabetes management programs. By addressing the specific needs of older adults with diabetes, we can take significant steps towards reducing the burden of vision problems and improving the overall health and well-being of this vulnerable population.

Supporting information

None

Ethical Considerations

Indian Council of Medical Research (ICMR) and the Institutional Review Board (IRB) of the International Institute for Population Sciences (IIPS), Mumbai, India provided ethical approval of this study (approval number not available in public domain) [19]. A formal written consent was acquired from all participants before the commencement of the interviews. Participants of the survey were briefed on the objectives of the survey, confidentiality measures, and safety protocols for health assessment during the consent procedure. Due to the nature of the LASI Wave I dataset being an anonymous and publicly accessible dataset without any personally identifiable details of the participants, there was no necessity for a distinct ethical endorsement for the analysis of this secondary data. The datasets were requested from IIPS, Mumbai, following the correct procedures, and obtaining the necessary permission. This secondary data analysis adhered to the principles outlined in the Declaration of Helsinki, ensuring confidentiality and anonymity of participants.

Acknowledgments

The authors extend their sincere gratitude to the IIPS for granting free access to the LASI Wave 1 datasets. The open access publishing fee is supported by the Qatar National Library.

Funding

The open access publication of this article was funded by Qatar National Library.

Author contribution statement

All authors contributed equally and attest they meet the ICMJE criteria for authorship and gave final approval for submission.

Data availability statement

LASI Wave 1 datasets are freely available to use upon reasonable request to IIPS (https://www.iipsindia.ac.in/content/LASI-data).

Additional information

No additional information is available for this paper.

Declaration of competing interest

The authors declared no potential conflicts of interest with respect to the research, authorship, and/or publication of this article.

References

1. Al-Namaeh M. Common causes of visual impairment in the elderly. Med Hypothesis Discov Innov Ophthalmol. 2021;10(4):191 [Crossref][PubMed][Google Scholar]

2. Kropp M, Golubnitschaja O, Mazurakova A, Koklesova L, Sargheini N, Vo TT, et al. Diabetic retinopathy as the leading cause of blindness and early predictor of cascading complications—risks and mitigation. EPMA Journal. 2023;14(1):21-42 [Crossref][PubMed][Google Scholar]

3. Congdon N, O'Colmain B, Klaver CC, Klein R, Muñoz B, Friedman DS, et al. Causes and prevalence of visual impairment among adults in the United States. Archives of Ophthalmology (Chicago, Ill. : 1960). 2004;122(4):477-85 [Crossref][PubMed][Google Scholar]

4. Swenor BK, Ehrlich JR. Ageing and vision loss: looking to the future. Lancet Glob Health. 2021;9(4):e385-6 [Crossref][PubMed][Google Scholar]

5. World Health Organisation (WHO). Diabetes. Available from: https://www. who.int/news-room/fact-sheets/detail/diabetes; 2023. Accessed February 29, 2024 [Crossref][PubMed][Google Scholar]

6. Lee R, Wong TY, Sabanayagam C. Epidemiology of diabetic retinopathy, diabetic macular edema and related vision loss. Eye Vis. 2015 Dec;2:1-25 [Crossref][PubMed][Google Scholar]

7. Malik C, Khanna S, Jain Y, Jain R. Geriatric population in India: Demography, vulnerabilities, and healthcare challenges. J Family Med Prim Care. 2021;10(1):72-6 [Crossref][PubMed][Google Scholar]

8. Sinha R, Pati S. Addressing the escalating burden of chronic diseases in India: need for strengthening primary care. J Family Med Prim Care. 2017 Oct 1;6(4):701-8 [Crossref][PubMed][Google Scholar]

9. Vashist P, Senjam SS, Gupta V, Manna S, Gupta N, Shamanna BR, et al. Prevalence of diabetic retinopahty in India: Results from the National Survey 2015-19. Indian J Ophthalmol. 2021;69(11):3087-94 [Crossref][PubMed][Google Scholar]

10. Xuan J, Wang L, Fan L, Ji S. Systematic review and meta-analysis of the related factors for diabetic retinopathy. Ann Palliat Med. 2022;11(7):2368381-2381 [Crossref][PubMed][Google Scholar]

11. Drinkwater JJ, Davis WA, Davis TM. A systematic review of risk factors for cataract in type 2 diabetes. Diabetes Metab Res Rev. 2019;35(1):e3073 [Crossref][PubMed][Google Scholar]

12. Cho H, Sobrin L. Genetics of diabetic retinopathy. Curr Diab Rep. 2014 Aug;14:1-7 [Crossref][PubMed][Google Scholar]

13. Nwanyanwu KH, Newman-Casey PA, Gardner TW, Lim JI. Beyond HbA1c: environmental risk factors for diabetic retinopathy. J Clin Exp Ophthalmol. 2015;6(2) [Crossref][PubMed][Google Scholar]

14. Shih K, Lam KS, Tong L. A systematic review on the impact of diabetes mellitus on the ocular surface. Nutr Diabetes. 2017;7(3):e251 [Crossref][PubMed][Google Scholar]

15. Lingam, G. and T. Y. Wong, Systemic medical management of diabetic retinopathy. Middle East Afr J Ophthalmol, 2013. 20(4):301-8 [Crossref][PubMed][Google Scholar]

16. Mohamed Q, Gillies MC, Wong TY. Management of diabetic retinopathy: a systematic review. JAMA. 2007;298(8):902-16 [Crossref][PubMed][Google Scholar]

17. Kim TH, Koo H, Han E. Healthcare use among persons with visual impairment: difference-in-difference estimations. Disabil Health J. 2019;12(2):302-9 [Crossref][PubMed][Google Scholar]

18. Bonsaksen T, Brunes A, Heir T. Quality of life in people with visual impairment compared with the general population. J Public Health. 2023:1-9 [Crossref][PubMed][Google Scholar]

19. Ministry of Health & Family Welfare, GOI. Longitudinal Ageing Study in India (LASI) Wave-1, India Report 2020. Available from: https://www. iipsindia.ac.in/content/lasi-publications; 2020. Accessed May 10, 2024 [Crossref][PubMed][Google Scholar]

20. Pan WH, Yeh WT. How to define obesity? Evidence-based multiple action points for public awareness, screening, and treatment: an extension of Asian-Pacific recommendations. Asia Pac J Clin Nutr. 2008;17(3):370 [Crossref][PubMed][Google Scholar]

21. Li Q, Wang M, Li X, Shao Y. Aging and diabetic retinopathy: Inherently intertwined pathophysiological processes. Exp Gerontol. 2023;175:112138 [Crossref][PubMed][Google Scholar]

22. Leley SP, Ciulla TA, Bhatwadekar AD. Diabetic retinopathy in the aging population: a perspective of pathogenesis and treatment. Clin Interv Aging. 2021:1367-78 [Crossref][PubMed][Google Scholar]

23. Ciarambino T, Crispino P, Leto G, Mastrolorenzo E, Para O, Giordano M. Influence of gender in diabetes mellitus and its complication. Int J Mol Sci. 2022;23(16):8850 [Crossref][PubMed][Google Scholar]

24. Zhang X, Gregg EW, Cheng YJ, Thompson TJ, Geiss LS, Duenas MR, et al. Diabetes mellitus and visual impairment: national health and nutrition examination survey, 1999-2004. Arch Ophthalmol. 2008;126(10):1421-7 [Crossref][PubMed][Google Scholar]

25. Liao YS, Tsai WC, Chiu LT, Kung PT. Educational attainment affects the diagnostic time in type 2 diabetes mellitus and the mortality risk of those enrolled in the diabetes pay-for-performance program. Health Policy. 2023;138:104917 [Crossref][PubMed][Google Scholar]

26. Fan C, Liu Y, Huai B, Sheng Y, Wu T, Gao W, Chen H, Wang H, Wang Y. Disease perception and experience in people with diabetic retinopathy: A qualitative study. Nurs Open. 2023;10(4):2150-7 [Crossref][PubMed][Google Scholar]

27. Tarboush NA, Abu-Yaghi NE, Al Ejeilat LH, Wahed RK, Jeris IN. Association of irisin circulating level with diabetic retinopathy: a case-control study. Exp Clin Endocrinol Diabetes. 2021;129(01):36-42 [Crossref][PubMed][Google Scholar]

28. Castro-Sánchez AE, Ávila-Ortíz MN. Changing dietary habits in persons living with type 2 diabetes. J Nutr Educ Behav. 2013;45(6):761-6 [Crossref][PubMed][Google Scholar]

29. Zatterale F, Longo M, Naderi J, Raciti GA, Desiderio A, Miele C, Beguinot F. Chronic adipose tissue inflammation linking obesity to insulin resistance and type 2 diabetes. Front Physiol. 2020;10:1607 [Crossref][PubMed][Google Scholar]

30. Mbata O, El-Magd NF, El-Remessy AB. Obesity, metabolic syndrome and diabetic retinopathy: Beyond hyperglycemia. World J Diabetes. 2017;8(7):317 [Crossref][PubMed][Google Scholar]

31. Rajagopal R. Weight reduction as an adjunctive management strategy for diabetic retinopathy. Mo Med. 2022;119(1):42 [Crossref][PubMed][Google Scholar]

32. Zheng DD, Christ SL, Lam BL, Feaster DJ, McCollister K, Lee DJ. Patterns of chronic conditions and their association with visual impairment and health care use. JAMA Ophthalmol. 2020;138(4):387-94 [Crossref][PubMed][Google Scholar]

Disclaimer / Publisher’s Note

The statements, opinions and data contained in all publications are solely those of the individual author(s) and contributor(s) and not of Journals and/or the editor(s). Journals and/or the editor(s) disclaim responsibility for any injury to people or property resulting from any ideas, methods, instructions or products referred to in the content.