THE EVIDENCE E-ISSN:3048-7870
Vol. 3 No. 1 (2025)
Review Article Public Health
www.evidencejournals.com
Cite this Article
Kaur M, Anil V, Mukhopadhyay I, Kaur S, Reetu, Punia A, Kumar R. Social determinants of health in India: a critical appraisal of the equity-oriented policies. THE EVIDENCE. 2025:3(1):1-16. DOI:10.61505/evidence.2025.3.1.126
Available From
https://the.evidencejournals.com/index.php/j/article/view/126

Received: 2024-12-06
Revised: 2025-01-24
Accepted: 2024-12-24
Published: 2025-01-30

Evidence in Context

• A logical framework was used to review social determinants of health policies on Government of India websites, combining qualitative and quantitative approaches.
• Budget and national survey data were analyzed to assess inputs and equity outcomes.
• India has implemented rights-based, equity-oriented policies in the social sector.

• Financial allocations to the social sector have increased.
• While social determinants of health have improved, inequities persist across socio-economic, geographic, gender, wealth, and caste groups.

To view Article

Social determinants of health in India: a critical appraisal of the equity-oriented policies

Manmeet Kaur1, Vyom Anil2, Indranil Mukhopadhyay3, Sandeep Kaur4, Reetu5, Ankur Punia5, Rajesh Kumar1*

1 Health Equity Action Learnings Foundation, Chandigarh, India.

2 Centre of Social Medicine and Community Health, Jawaharlal University, New Delhi, India.

3 Jindal School of Government and Public Policy, OP Jindal Global University, Sonipat, India.

4 Indian Institute of Public Health, Public Health Foundation India, Gurugram, India.

5 Department of Community Medicine and School of Public Health, Postgraduate Institute of Medical Education and Research, Chandigarh, India.

*Correspondence:

Abstract

Background: Context-specific policies on social determinants of health (SDH) have been advocated to achieve health equity goals. Therefore, we reviewed the policies and assessed the progress achieved in health equity in India.

Methods: A logical framework with qualitative and quantitative approaches was used to review the contents of policies identified from government websites, and data from the budget and national sample surveys were used to assess inputs and equity outcomes.

Results: India has formulated several rights-based equity-oriented policies and increased financial allocations to the social sector. Civil participation has increased especially among the marginalized population. The Right to Education Act has made education free and compulsory for children. Initiatives on poverty alleviation have led to improvements in living conditions. The National Food Security Act provides subsidized food grains to about 2/3rds of the country's 1.4 billion population. However, undernutrition remains a major issue. Infant Mortality Rate (IMR) has declined from 58 in 2004-05 to 30 per thousand live births in 2019-21, and the gap in IMR has narrowed down between states, various socioeconomic groups, and urban and rural populations.

Conclusions: Although policy initiatives have improved SDH to some extent but inequity in socio-economic, rural-urban, gender, wealth, and caste groups persists in India.

Keywords: Social determinants of health, policy, equity, evaluation, India

Introduction

The principle of health equity advocates that everyone irrespective of their race, ethnicity, socioeconomic status, gender, age, or geographic location should have the opportunity to attain the highest level of health. However, several factors related to access to resources and opportunities constrain peoples’ ability to enjoy their lives with good health and well-being. Those factors which influence health directly or indirectly have been categorized as social determinants of health (SDH) [1].

Addressing SDH through policy actions, that a country needs to take to close the

© 2025 The author(s) and Published by the Evidence Journals. This is an open access article under the terms of the Creative Commons Attribution License, which permits use, distribution and reproduction in any medium, provided the original work is properly cited.

Download PDFBack To ArticleIntroductionMethodsResultsDiscussionConclusionReferences

inequity gap in health, is challenging. The Commission on Social Determinants of Health (CSDH) provided a model for achieving health equity [2]. Others have emphasized that political, commercial, and environmental determinants also hamper the realization of health equity. However, these determinants are interconnected and have interdependence [3]. The relative importance of these determinants may vary based on the specific health issue, population dynamics, and time frame, underscoring the need for tailored approaches to improve health equity.

The overarching recommendations of the CSDH were to “Improve Daily Living Conditions, Tackle the Inequitable Distribution of Power, Money, and Resources, and Measure and Understand the Problem and Assess the Impact of Action” [2]. At the World Conference on SDH held in Rio de Janeiro in 2011, a global political commitment was made to adopt the SDH Approach to reduce health inequalities [4].

In the last two decades, most societies around the world have been able to improve health outcomes [5]. While improvement in health indicators is a positive step, it doesn't automatically translate to a reduction in health inequities. Context-specific structural interventions focused on addressing health disparities are needed to achieve health equity goals [6].

The literature review of the last decade indicates that few studies on SDH and health inequities have been published [7-9], but academic discourse on social determinants of health and health inequity has been scanty in India. Therefore, we conducted a critical review of the legislations, regulations, policies, and programs in India to find out what efforts have been made and what progress has been achieved in addressing the social determinants of health, especially to find out whether the existing health disparities in gender, caste, economic groups, and regions have improved or worsened at the population level.

Methods

Overall, the study followed a logical framework for the assessment of policy inputs/processes, and outcomes in India using a mix of qualitative and quantitative approaches. With a population of about 1.4 billion, India is governed by a democratic federal political system that includes the Union Government, 28 State Governments, and 8 Union Territory (UT) Administrations. At the local level, there are Panchayats (Councils) in rural areas and Municipal Committees/ Corporations in urban areas. Each of these governing entities has been assigned their responsibilities in the Constitution of India through the Union list, State list, and a Concurrent list of subjects, where both Union and State can act. Local Self-Governments also have responsibilities for specific subject areas as specified in the 73rd and 74th Constitution Amendments [10]. However, this study examined the policies formulated by the government of India after the establishment of the Commission on Social Determinants of Health with special reference to their direct or indirect contributions to social determinants of health equity. The Commission on Social Determinants of Health Conceptual Framework [2] has been used to select relevant policies for this review.

A critical qualitative analysis of the policies in the relevant sectors (Table 1) was carried out to understand the intent and processes in terms of improvements in living conditions, power dynamics, and resource distribution that the government had launched in the past keeping in view the CSDH recommendations. Policies related to SDH were identified from government websites. In addition, PubMed, Web of Science, Science Direct, Google Scholar, and Scopus were used to identify studies in Indian settings from 2012 to 2022. Keywords used in the literature search were ‘Health Equity’ or ‘Social Determinants of Health’, and ‘India’. The contents of the articles and policies were critically analyzed using R Qualitative Data Analysis version 0.3-1, 2018.

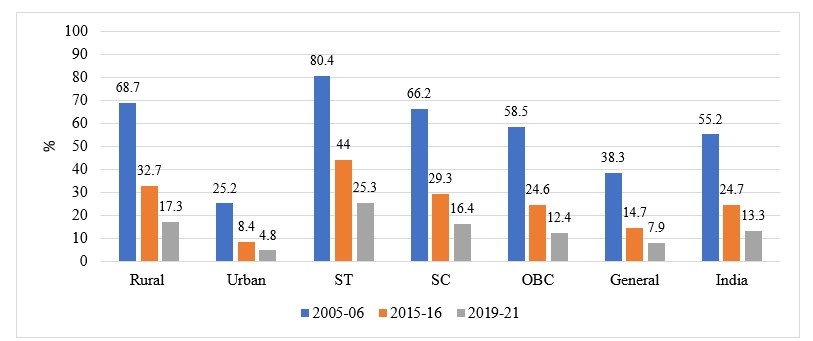
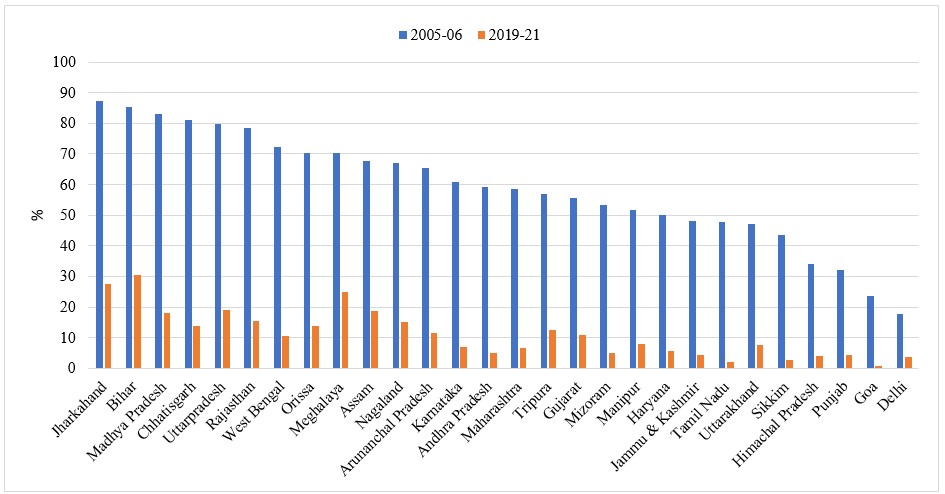
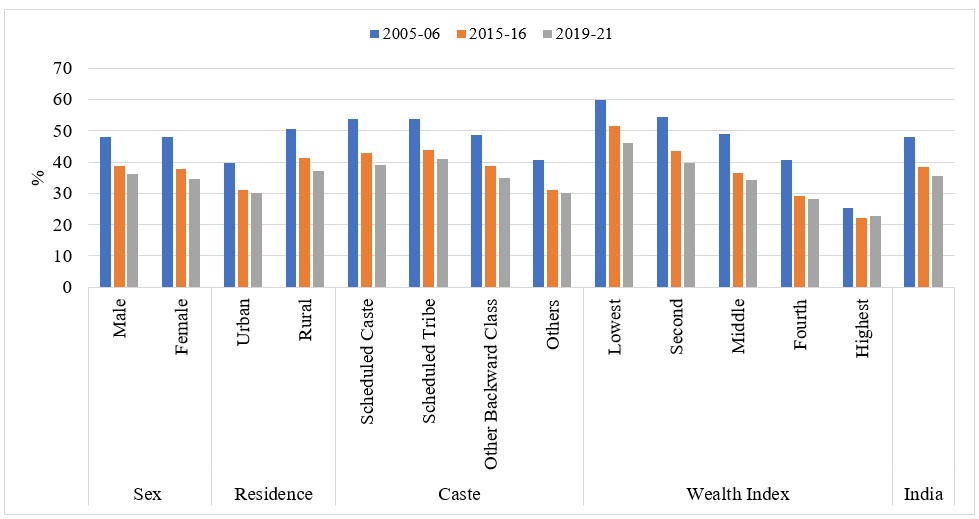
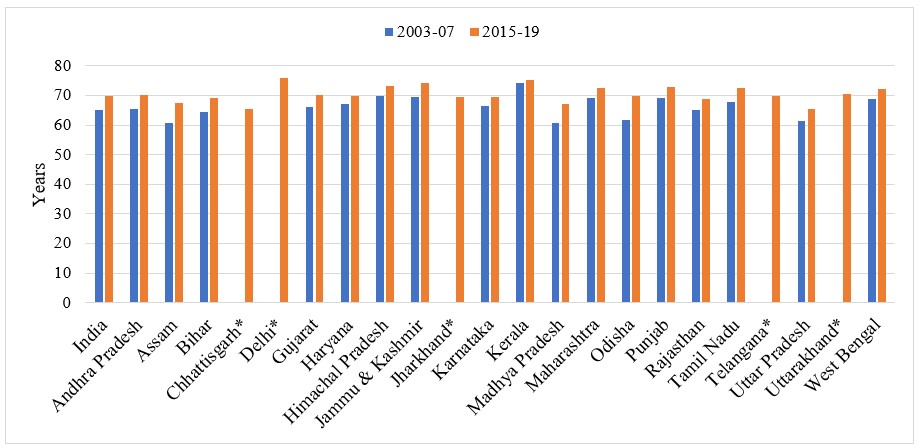
Quantitative data from budget allocations and national surveys were used for assessment of the program inputs and coverage/outcomes. The National Family Health Surveys (NFHS) performed in 2005-06, 2015-16, and 2019-21 provided information on changes in social determinants of health and infant mortality rate [11]. National Sample Surveys have been utilized to explore trends in out-of-pocket expenditure on health [12]. Sample Registration Surveys were used to find out the time trends in life expectancy [13]. Economic Surveys of the Government of India were used to find out financial allocation to various sectors in India [14]. Health equity measures available in these surveys were wealth index, caste, gender, and place of residence. Time trends have been estimated across different population strata in terms of relative or absolute differences.

Table 1. Critical analysis of legislations, policies and programs related to social determinants of health in India

Legislations/Policies/ProgramsIntent and outcome
I.  Legislations & Codes
Right to Information Act (RTI), 2005The RTI Act promotes transparency and accountability in the functioning of public authorities. It has empowered the poorest, least educated, and most disadvantaged segments of society to seek and obtain information from the government and even ensures assistance to those having problems of vision or those who are unable to read. Thus, it is advancing social equity by ensuring access to information for all.
Mahatma Gandhi National Rural Employment Guarantee Act (MGNREGA), 2005The MGNREGA, earlier known as NREGA, has been operational since 2006 to improve the security of livelihood in rural communities by ensuring at least 100 days of work employment to at least one member of every household in a financial year. One-third of the jobs are made available to women under the MGNREGA. In addition to creating rural assets and providing economic security, it helps in environmental protection, women empowerment, reducing urban migration, and advancing social equity.
Right of Children to Free and Compulsory Education Act, 2009Government authorities are obliged to provide elementary education for children in the age group of 6 to 14 years, hence, it is also referred to as the ‘Fundamental Right to Education’. It emphasizes equity by promoting educational opportunities, regardless of gender, socioeconomic background, or disability. It emphasizes the involvement of parents and local communities in the management of schools by empowering parents to choose schools for their children.
National Food Security Act (NFSA), 2013The NFSA mandates the distribution of subsidized food to 50% urban and 75% of the rural population using the public distribution system, marking a shift from a welfare-based to arights-based food security approach. Pregnant and lactating mothers are to be provided free of cost nutritious meals under the Integrated Child Development Services Scheme. There is a provision of conditional cash transfers of a fixed cash amount to pregnant and lactating mothers.
Labour Codes (Code on Wages, 2019; Industrial Relation Code, 2020; The Code on Social Security, 2020; The Occupational Safety, Health and Working Conditions Code, 2020).The labour codes consolidate provisions of several labour laws, ensuring uniformity and transparency. The code on wages emphasizes equal pay for men and women and aims to reduce income disparities, encourage formal employment, and improvement in job security and social benefits. The Industrial Relations Code promotes equity in negotiations through efficient dispute-resolution mechanisms. The Social Security Code focuses on comprehensive social security coverage for all workers, especially by extending social security benefits to gig workers, platform workers, and informal sector employees, thus it promotes equity. The Occupational Safety, Health, and Working Conditions Code is to protect workers, especially those in hazardous occupations and gig workers, ensuring their well-being and equitable treatment. Trade union’s concerns regarding the new labour codes are related to a weakening of job security, social security, and bargaining power of workers.
II.  Policies
National Policy on Empowerment of Women (NPEW), 2001NPEW is comprehensive and emphasizes economic, social, political, and legal empowerment. In pursuance of this policy, legislations have removed gender-based discrimination in property rights. Several schemes such as Beti Bachao Beti Padhao, Sukanya Samriddhi Yojana, Ujjwala, etc. have been launched, however, deep-rooted patriarchal norms and socioeconomic barriers continue to impede women's empowerment. A significant gap remains between policy and practice. Most importantly, empowerment, which should ideally encompass autonomy and self-determination, is diluted into mere programmatic interventions without addressing the underlying power dynamics and structural inequalities. Monitoring, genuine community engagement, and sustained efforts to shift societal attitudes are crucial for the policy to move beyond rhetoric to real change in the lives of women in India.
National Environment Policy, 2006The National Environment Policy acts as a comprehensive guideline for sustainable development and environmental governance. Equity and inclusivity are indirectly addressed through environmental standards and capacity building. There is less emphasis on empowering local communities. The use of traditional knowledge to mitigate climate change needs to be recognized. Massive intrusions of ‘development’ projects into natural ecosystems can systematically weaken the regulatory procedures.
National Urban Housing and Habitat Policy, 2007The policy aims for `Affordable Housing for All’. Its focus is to promote equity by earmarking land for economically weaker sections in new housing projects while maintaining Government's role in social housing. It also encourages the establishment of tenant associations with the active involvement of NGOs. The government’s active involvement ensures equitable access to housing and services.
National Policy for Farmers, 2007The central government’s Ministry of Agriculture has been changed to the Ministry of Agriculture and Farmers’ Welfare (MAFW) in 2015. The 10th Five-Year Plan recognized that, self-sufficiency in food production has been attained but it has not led to nutritional security of the poorer sections of the society. The Agricultural Produce Market Committee (APMC) Model Act, 2003 ensured that traders do not exploit farmers and that farmers can sell their produce through auction at APMC markets. The Minimum Support Price (MSP) is a crucial price policy to ensure that farmers get fair prices for their produce.
National Land Reforms Policy, 2013The main objective of land reform measures in India includes enhancing the economic conditions of farmers and tenants by establishing proprietorship with the aim of “land to the tiller.” It focuses on safeguarding the land rights of the Scheduled Castes, Scheduled Tribes, and Women. It improved the delivery system to address litigations. However, the support systems for the poor need to have effective liaisons with the Department of Land Administration.
National Policy for Skill Development & Entrepreneurship, 2015The policy aims to empower individuals to realize their potential by lifelong learning. It ensures that the needs of the socially disadvantaged are addressed. Skills development is a shared responsibility involving various stakeholders. Employers are accountable for providing gainful employment to skilled workers with adequate compensation.
National Health Policy, 2017This policy aims to promote good health through cross-sectoral actions, including medical pluralism, knowledge building, and urban health care. It focuses on strengthening governance and regulatory frameworks, ensuring accountability. Financial protection strategies are aimed at reducing catastrophic health expenditures. It encourages multi-sectoral action involving non-health ministries, academic institutions, and not-for-profit organizations.
III.  Programs/Missions
National Water Mission, 2011Water policy aims to improve access to safe and sufficient drinking water, sanitation, and hygiene. Initiatives such as rural water supply projects and community-led groundwater management focus on providing clean drinking water to rural communities. It strives to balance power by involving local communities in decision-making. It ensures that marginalized and vulnerable populations have equal access to water.
National Rural Health Mission, 2005 & National Urban Health Mission, 2013National Rural Health Mission and National Urban Health Mission operate under the National Health Mission umbrella. They cater to distinct populations (rural and urban) and have specific programmatic components tailored to their respective contexts. Inequities in institutional delivery declined significantly, especially in high-focus states. Institutional delivery increased across socio-economic categories. Its impact underscores the importance of comprehensive public health programs and sustained efforts toward universal access to healthcare. NUHM addressed health disparities in urban settings.
Swatch Bharat Abhiyan, 2014Swachh Bharat Abhiyan intends to promote cleanliness, eliminate open defecation, improve solid waste management to encourage sustainable sanitation practices, and create awareness about health and hygiene. It indirectly impacts inclusivity, accountability, and overall quality of life. Citizens’ active participation is crucial as the infrastructure creation, operation, and management are under the local self-government.
Ayushman Bharat Mission, 2018Ayushman Bharat Mission (ABM) consists of (a) Health and Wellness Centers (HWCs), (b) Pradhan Mantri Jan Arogya Yojana (PMJAY). While HWCs focus on delivering comprehensive primary health care, PMJAY offers financial protection for secondary and tertiary care to about 40% of lower socio-economic population. While ABM is a significant step towards universal health coverage, its success hinges on overcoming implementation challenges and ensuring sustained financial and political commitment.

Results

After the establishment of CSDH in 2005, several policy initiatives on civil participation, poverty, nutrition, health, education, water supply and sanitation, housing, employment, and public infrastructure have been taken in India, and financial allocations to the social sector have also increased. Specific content analysis of policies most relevant to SDH has been displayed in Table 1, and financial allocation to the social sector as a percentage of Gross Domestic Product (GDP) is exhibited in Table 2. The salient features of the policies and their impact on equity are presented below.

Civil engagement

The Constitution of India provides for the “Right to Equality”, and the Directive Principles of State Policy emphasize duties of State to take affirmative action for promoting social, economic, and

political justice, fighting income inequality, and individual dignity [10]. Hence, the Constitution of India mandates seat reservation in Parliament and State Legislative Assemblies for Scheduled Castes and Scheduled Tribes (SC/ST) proportionate to their population.

Indian elections have witnessed an upsurge in electoral participation. The parliament elections had witnessed a turnout of less than 60% in the past, but recent elections have witnessed higher participation of the voters from the marginalized sections of society [15]. Women who had voted in less numbers compared to men are now voting in greater numbers. There is also an upsurge of youth participation. However, representation of Muslims in the Parliament remains less than 5% (against a population of 14%) over the last three terms [16].

Table 2. Expenditure on Social Sector in India as a Percentage of GDP

YearPercentYearPercent
2004-055.32013-145.7
2005-065.52014-156.6
2006-075.62015-166.8
2007-085.82016-176.7
2008-096.82017-186.7
2009-106.92018-196.8
2010-116.82019-206.8
2011-126.42020-217.5
2012-136.62021-227.6

Source: Economic Survey, Ministry of Finance, Government of India, New Delhi
https://www.indiabudget.gov.in/economicsurvey/

The Panchayat (village council) and Municipalities are elected by the people. In these councils, besides SC/ST, and other Backward Class candidates, women also have reserved seats. Through the 73rd & 74th Constitution Amendments in the early 1990s, local self-governments were also empowered to implement schemes related to SDH [17].

Besides the elected representation, there are procedures and processes to support a representation of groups from civil society in decision-making, but their participation in policy development is still weak. Social Audit has been established in the Mahatma Gandhi National Rural Employment Guarantee Act (MNREGA) [18] and community monitoring has been advised in the National Rural Health Mission [19].

The Right to Information Act (RTI) 2005 specified rules and procedures regarding citizens' right to information [20]. However, provisions of the Act have been weakened over the last few years. Display of citizen charter is mandatory under the Clinical Establishment Act (CEA), 2010 and citizen charter have been displayed in most of the government health facilities and a few private facilities, but CEA is yet to be implemented in the private sector in all States and UTs of India [21].

Women empowerment

National Policy on Empowerment of Women (2001) has shaped various policies so that women can realize their optimal potential [22]. In 2005, India started issuing a gender budget with the Union budget. However, as a proportion of Union Budget, allocation to gender budgets has remained between 3 to 6 per cent of the Union budget [23]. Representation of women in parliament and state legislative assemblies is low. However, an increase in women's participation has been seen from 5% in the first elected Parliament in 1952 to 15% in the 17th Parliament [24]. But on average only 9% of legislators in 20 state legislative assemblies and union territories are women. Therefore, Nari Shakti Vandan Adhiniyam, 2023 mandated the reservation of 33% of all the parliament and state legislative assembly seats for women [25]. However, it will be implemented for the next 15 years, following the delimitation of parliamentary constituencies after the upcoming census.

Income and wealth

The central focus of the Government of India since independence has been to eradicate poverty. Several initiatives on poverty alleviation such as access to land resources, economic growth, microfinance, employment guarantee, etc. have led to some improvements in living conditions.

In a mainly agrarian society, access to land for farming is critical for rural livelihoods. Hence, in 2013, a national land reform policy was formulated to address the issue of landlessness but remains to be implemented [26]. The Mahatma Gandhi National Rural Employment Guarantee Act 2005 (MGNREGA) has provided safety net to rural populations. According to the National Council of Applied Economic Research (NCAER), MGNREGA has significantly lessened poverty among the socially weaker sections [27].

The population below the poverty line, based on per capita consumption expenditure per month as defined by the Tendulkar Committee established by the government of India, declined from 37.2% in the year 2004-05 to 21.9% in 2011 and 3% in 2022-23 [28]. Other measures of poverty such as the Multidimensional Poverty Index decreased significantly from 0.301 in 2005–06 to 0.059 in 2019–21 (a relative decline of 80%). In this period, the decline in multidimensional poverty was observed across several population groups (Figure 1 and 2) [29].

theevi-126-1.jpg

Figure 1: Multidimensional Poverty Trends in various population groups in India
(Source: Das et al. https://doi.org/10.1007/s10708-023-10833-6)

Economists argue that the rapid growth of the Economy (7.2%) has been the main contributor to the poverty decline in the past few decades. The per capita GDP has increased from $442 in 2000 to $2,389 in 2022 [30]. However, income inequality has been rising. The share of the national income of the top 1% has consistently increased from 19.3% in 2005 to 22.6% in 2022 but the share of the bottom 50% has declined from 18.4% in 2005 to 15% in 2022 [31]. A large proportion (~90%) of India’s workforce continues to be employed in the unorganized sector.

theevi-126-2.jpg

Figure 2: Multidimensional poverty trends by states from 2005-06 to 2019-22
(Source: Das et al. https://doi.org/10.1007/s10708-023-10833-6)

Education and skill development

The Right to Education Act, 2009, made education free and compulsory for children in the ages of 6 and 14 years [32]. Near universal enrolment in elementary education (6-14 years) has been achieved. However, enrolment at the secondary level and higher education continue to be low, and differential exit between rural and urban areas, gender, and social class (caste) [33].

Overall, the literacy rate has increased from 64.8% in 2001 to 73.0% in 2011. Male and female literacy rates have improved from 75.3% to 80.9% and 53.7% to 64.6% in the same period. Illiteracy has declined; however, inequality persists in various population groups (Table 3). For instance, 45.7% of women belonging to the poorest wealth quintile have not been to school compared to 11.4% in the highest quartile. Education inequality is high at higher education levels as compared to primary, upper primary, and higher secondary levels [34].

Table 3: Time trend in ‘no schooling’ among aged six years or more in India 

Characteristics2005-062014-152019-21
FemaleMaleFemaleMaleFemaleMale
ResidenceUrban25.312.519.28.917.47.8
Rural48.826.636.818.433.216.4
CasteScheduled Caste49.327.136.218.832.616.5
Scheduled Tribe58.335.742.52438.521.2
Other Backward Class44.722.431.914.828.813.1
Other28.414.221.59.819.59
Wealth IndexLowest67.244.751.631.345.727.5
Second5530.239.619.735.517.6
Middle44.321.731.214.328.312.5
Fourth29.412.221.78.7207.9
Highest13.24.411.73.611.43.7
Total41.521.93115.128.213.5

New education policy (NEP) 2020, aims to extend universal access to quality education for children in the age of 3 to 18 years [35]. The NEP emphasizes the need to provide healthy breakfast along with mid-day meals for children in rural areas. The education policy has been linked to Digital India Mission to reduce the digital divide to make online education accessible to everyone. However, experience during COVID-19 suggests that a large section of households in rural areas, particularly among marginalized groups did not have access to smartphones, to be able to take advantage of digital education [36]. The National Policy on Skill Development is a positive step, however, many shortcomings exist in vocational education systems [37].

Housing environment

Housing issues in India often differ significantly between urban and rural areas. While urban areas face challenges related to high housing costs and informal settlements, rural areas suffer from inadequate housing infrastructure and access to basic amenities. The National Urban Housing Policy targets to provide “Housing for all” at affordable prices. The government has commenced initiatives like the Pradhan Mantri Awas Yojana for providing affordable housing as affordability is a major issue for many low-income and marginalized communities [38]. The policy focuses on economically weaker sections and marginalized groups. The National Homestead Bill of 2013 was drafted to ensure a homestead land to every entitled rural landless person [39]. According to National Family Health Survey data, access to a pucca house has improved from 45.9% in 2005-06 to 63.3% in 2019-21 [11] but large disparities remain between urban and rural areas.

Living conditions are dependent upon income, and housing conditions. According to world bank there is reduction in urban slum population from 55% in 2000 to 49% in 2020. This reduction is slow as compared to other LMICs and the growing inequity in incomes can lead to increase in slum population.

Improvements in the household environment have been prioritized as well. The Swachh Bharat Mission [40] and Jal Jeevan Mission [41] initiatives by the government are meant to contain infectious diseases, which also impose behavioural reward and punishment models to make sure

the scheme works, along with coordination with self-help groups, corporate houses, and non-governmental organizations (NGOs). Pradhan Mantri Ujjwala Yojana (PMUY), provides free liquefied petroleum gas (LPG) connections to women from below poverty households to improve access and reduce the health hazards associated with traditional cooking methods [42].

According to NFHS, the proportion of households with improved drinking water sources and sanitation facilities has increased in the last two decades (Table 4). Electricity supply has increased from 67.9% (2004-05) to 96.8% (2019-21) and clean fuel use for cooking has increased from 25.5% (2004-05) to 58.6% (2019-21), however large disparities remain in various socio-economic groups [11]. There are many issues related to sewer drainage and solid waste disposal systems, and ambient air quality continues to be poor [43].

Table 4. Access to improved drinking water, sanitation, clean cooking fuel, and pucca housefrom 2005-06 to 2019-21, India

CharacteristicsImproved drinking water %Improved sanitation facility %Clean cooking fuel %Pucca house %
2005-062014-152019-212005-062014-152019-212005-062014-152019-212005-062014-152019-21
ResidenceUrban96.0198.3498.6652.9470.4980.7460.1380.5989.6581.5986.2985.8
Rural84.8492.5194.5217.6736.7463.68.7924.0243.2128.9342.8548.71
CasteScheduled caste90.1195.8396.7518.2737.3162.1914.4733.5452.6735.4849.5753.94
Scheduled tribes70.9683.6788.2710.542655.628.3517.6132.5916.7331.3136.11
Other backward class88.4495.1596.6424.6248.4670.8122.5345.0160.7845.759.5863.28
Others92.5396.4697.0446.9265.7179.3242.1960.3373.1262.4672.9775.18
WealthLowest79.2989.491.571.356.0336.680.050.778.860.173.918.72
Second85.5892.2594.736.0923.1756.660.317.7436.379.6530.7342.45
Middle89.0994.8396.415.9245.0772.824.138.767.4744.7967.7773.18
Fourth92.2297.3297.9842.4674.5686.735.5176.7486.779.7188.1387.78
Highest96.5698.9199.0480.793.5495.6388.0694.4196.8897.4496.6195
India88.4894.5495.8929.1848.5169.2825.5342.358.6246.1258.1761.04

Source: National Family Health Surveys https://rchiips.org/nfhs/

Agriculture, food and nutrition

The Agriculture Policy aims to actualize the potential of agriculture to achieve more than 4% per year growth rate. Climatic changes may affect agricultural production severely. To tackle this problem, the Government of India launched the National Mission for Sustainable Agriculture, suggesting certain crops and animal husbandry measures in 2014-15 [44]. India has achieved self-reliance in food production. There is an increase in food grain production from 1652 million metric tons in 2004-05 to 2394 million metric tons in 2020-21 [45]. National Food Security Act (2013) mandates subsidized food grains to about 2/3rd population of the country using the public distribution system (PDS) [46]. However, undernutrition continues to be a major issue.

National Nutrition Mission has set the target of a 3-point percentage per year reduction in underweight and a 2% per annum reduction in stunting i.e. low height for age in children [47]. These targets are to be achieved in coordination with the National Food Safety Act (NFSA) and Integrated Child Development Services (ICDS) along with centrally sponsored schemes like Pradhan Mantri Matrutva Vandana Yojna (Prime Minister Maternity Benefit Scheme).

Undernutrition has improved to some extent. Stunting among under-five children has declined from 48.3% in 2005-06 to 35.5% in 2019-21 [11]. However, disparities in stunting exist and are exacerbated by the intersection of lower household wealth and belonging to a marginalized group (Figure 3). Among children aged 6-59 months, the incidence of anaemia has increased from 58.6 % in 2015-16 to 67.1 % in 2019-21 [11].

theevi-126-03.jpg

Figure 3: Stunting (height for age <2 SD) trends among under-five children

Healthcare

India’s health sector is growing and modernizing, however, it has not kept pace with the rising demand, as public health spending is just 1.4% of the GDP, although National Health Policy (NHP) 2107 envisaged lifting public health expenditure to 2.5% of the GDP by 2025 [48].

The National Health Policy (NHP) 2017 states that “underlying social, economic, and environmental factors influence health outcomes”. The first objective of NHP mentions ‘mobilization of all stakeholders from different sectors for public health management’, and it proposes to “institutionalize inter-sectoral coordination at national and sub-national levels to optimize health outcomes, through the constitution of bodies that have representation from relevant non-health ministries” [48]. The National Rural Health Mission launched in 2005 also identified Nutrition, Water, and Sanitation for intersectoral action [49]. A combined budget for public health was presented recently which included WASH, Nutrition, & Health. In line with this idea, all sectors were involved in the prevention and control during the COVID-19 pandemic – a whole-of-society approach indeed. However, explicit legislation for ensuring Health-in-All Policies (HiAP) is yet to be enacted by the Parliament of India.

NHP 2017 mainly aims to establish a fairer healthcare system by enhancing the accessibility, affordability, and quality of healthcare services. It affirms the provision of comprehensive primary health care services to everyone at no cost. Since private sector provides 70% of outpatient and 60% of inpatient care, a public-private partnership has been proposed, and government-funded health insurance has been emphasized. Ayushman Bharat Health and Wellness Centres (AB-HWCs), now known as Ayushman Arogya Mandirs, have been established for comprehensive primary health care for all age groups in rural areas and urban slums, in addition to the Prime Minister Jan Arogya Yojana (PMJAY) – social health insurance to about 40% vulnerable population of India [50].

The Government Health Expenditure (GHE), as a percent of Total Health Expenditure (THE) has increased from 22.5% in 2004-05 to 40.8% in 2017-18. However, Per-capita GHE remains much lower compared to most other countries in the region- a third of what is spent by Sri Lanka, a tenth of Malaysia, or a fifteenth of Thailand or China [51]. Household coverage, with any usual member covered under a health insurance/ financing scheme, has increased from 4.8% (2004-05) to 41.0% (2019-21) [11]. However, tertiary care is still unaffordable to most middle and low-income families as the universalization of social insurance is yet to be done. The National Health Account indicates that there is a decline in out-of-pocket expenditures on health (OOP) [52] which is based on NSSO data but is contested by others. However, a study reflected that OOP among older people did not reduce [53].

Outcome indicators of health have been improving since independence. Maternal Mortality Ratio (MMR) has declined from 250 (2004-05) to 103 (2017-18) per 100000 live births and Infant

Mortality Rate (IMR) has dropped from 58 (2004-05) to 30 (2019) per thousand live births. Over the years, the IMR gap has narrowed between social and economic groups and between urban and rural areas (Table 5) [11].

Table 5. Infant mortality rate trends per 1000 livebirths in India

Characteristics2005-062015-162019-21Difference
SexMale56.329.337.4-18.9
Female57.727.732.8-24.9
ResidenceUrban41.528.526.6-14.9
Rural62.245.538.4-23.8
CasteScheduled Caste66.445.240.7-25.7
Scheduled Tribe62.144.441.6-20.5
Other Backward Class56.642.134.1-22.5
Others48.932.128-20.9
Wealth IndexLowest70.456.348-22.4
Second68.547.240.9-27.6
Middle58.339.233.7-24.6
Fourth4429.628.5-15.5
Highest29.219.817-12.2
Total5740.735.2-21.8

Source: National Family Health Surveys https://rchiips.org/nfhs/

Life expectancy (LE) has improved from 65 years in 2003-07 to 69.7 in 2015-19 [13]. The LE of men compared to women was 2.8 years lower in 2003-07 and this gap continues to be similar in 2015-19 (2.7 years). In the same period, the LE gap between rural and urban areas has narrowed marginally (from 4.8 years to 4.7 years). A large differential in LE exists between states ranging from 65.3 years in Chhattisgarh to 75.9 years in Delhi, however, over the years, the LE gap between states has narrowed down (Figure 4). Differentials in LE by socio-economic status exist. According to NFHS-4 (2014-15) mortality data analysis, compared to the general caste the LE among ST, SC, and OBC was lower by 4, 4.9, and 2.9 years respectively (Table 6) [54].

Table 6. Life expectancy by sex and residence from 2003-07 to 2015-19, India

PeriodMid-YearTotalRuralUrban
TotalMaleFemaleTotalMaleFemaleTotalMaleFemale
2003-0720056563.766.563.862.665.26967.570.7
2004-08200665.46466.964.262.965.76967.570.8
2005-09200765.764.367.264.563.26669.267.671
2006-10200866.164.667.764.963.566.569.66871.4
2007-11200966.564.968.265.363.86770.168.471.9
2008-1220106765.468.865.864.267.670.66972.4
2009-13201167.565.869.366.364.668.171.269.673
2010-14201267.966.469.666.765.168.471.57073.2
2011-15201368.366.97067.165.668.771.970.573.5
2012-16201468.767.470.267.46668.972.270.973.5
2013-1720156967.870.467.766.46972.471.273.7
2014-18201669.468.270.768.066.769.372.671.573.8
2015-19201769.768.471.168.366.969.77371.874.2

Source: Sample Registration System https://censusindia.gov.in/census.website/data/SRSALT

Discussion

In the last two decades, several welfare policies on poverty alleviation, education, food and nutrition, housing, water supply, and sanitation have been adopted in India to improve social determinants of health (Table 1). The multidimensional poverty index, which combines

17 indicators of social welfare, has shown significant improvement, and health indicators have also registered improvement in all segments of the population, however, large equity gaps remain particularly between rural and urban areas, between states, among genders, and in OBC, SC, and ST populations; [55] and wealth inequality is also on the rise [31]. Broader social and economic policies, such as those related to taxation, employment, and social safety nets, are needed that can influence income re-distribution and access to resources that affect health, as education and health policies may not lead to health equity unless supported by economic policies which determine the structure of a society. The GDP growth in India has not reduced the gap between rich and poor; therefore, it calls for the attention of policymakers.

theevi-126-04.jpg

*2003-07 data for Chhattisgarh, Delhi, Jharkhand, Telangana, and Uttarakhand states is not available as these states were created after 2007

Figure 4: Life Expectancy trends in major states of India
Source: Sample Registration System https://censusindia.gov.in/census.website/data/SRSALT

India’s economy shifted significantly to liberalization in the 1990s, after decades of socialistic agenda following the independence in 1947. These reforms boosted growth, attracted foreign investment, and dismantled bureaucratic barriers to some extent. India experienced an increase in per capita income. Irrespective of these efforts, the Gini coefficient was 0.352 in 2011. India is a paradox; it is among the top 10 richest countries globally in terms of total wealth, yet with stark disparities.

Unequal access to power and resources is the main issue as there is visible discrimination against other backward classes, scheduled castes, and scheduled tribes that restrict access to civil participation, income, medical facilities, insurance coverage, and healthcare provisions which further leads to health inequities. Cultural competence of the health workforce, language barriers, and biases can impact the care individuals receive. The ability to access and understand health information is essential. Health literacy and education programs can help bridge gaps in knowledge and access to resources. Healthcare providers and institutions must be culturally competent and sensitive to the needs of diverse populations to ensure equitable care. Policy changes in these domains can have a significant impact on health equity. Strong social networks and support systems can buffer the effects of discrimination and adversity on access to healthcare.

National Health Policy 2017 explicitly mentions health equities as an important principle and supports inter-sectoral actions to address key determinants of health. In pursuance of NHP 2017, a comprehensive primary healthcare approach to provide accessible, affordable, and equitable services closer to the communities which simultaneously addresses wider determinants of health has been stated in the Ayushman Bharat Mission [50]. A perusal of National Health Accounts indicates that intentions are being translated into programs, and several social health insurance schemes have been operationalized for various social groups. However, World Economic Forum 2024 has brought to light health system's failure in responding to the health needs of women during the pandemic.

WHO Commission on SDH reported sufficient evidence that links economic inequity to social problems and health. Severe income inequality is persisting in most countries but in India, it is increasing. Inequality is a big barrier in reducing poverty. But putting together social, commercial and political determinants of health, one needs to consider the relative impact of proximate, distal, and fundamental determinants of health also. Global and local opportunities need to be created which can catalyse structural changes in the distribution of resources to promote planetary health. The results of the present study are indicating that policy changes and the incremental changes through policy implementation are not sufficient for transformational changes and health equity. Future research should focus on a Comprehensive Framework of Social, Commercial, and Political Determinants of Health.

The limitation of this policy analysis is that we have conducted the review at the national level and it is focused only on policies formulated by the Union Government and implemented by the state governments. However, state and local governments also frame policies that affect social determinants of health equity especially when health is primarily a state subject in India, hence, future studies should also include state and local government policies in the analysis, although we have included time trends of selected coverage and impact indicators from the datasets of National Surveys which reflect the outcomes of the union and state-level policies and financial allocations in terms of gender, caste, wealth, and place of residence. National sample surveys provide data for estimating time trends, their limitations related to sampling biases and the accuracy of reported information should be kept in mind while interpreting the trends [56]. However, a larger set of indicators has been proposed in international literature which should be utilized in the future while monitoring social determinants of health equity [57-58]. An in-depth analysis from the political economy lens is also needed to understand the power dynamics behind the policy actions.

Conclusion

Social determinants of health inequity in India have many layers. Some of the layers are like other countries such as wealth, gender, education, and occupation. In addition, caste, and tribal affiliations also affect SDH and health care in India. Not only States are socioeconomically unequal, but inequities exist between urban and rural areas within the States. Access to infrastructure and services is unequally distributed in rural and urban areas. Gender and caste inequities are still glaring.

To achieve the health equity goals, the decentralized approach and community processes must be strengthened with higher allocations for the social sector. Community collectives and community-based platforms need to be reinforced to monitor the progress. Governance mechanisms for planning and monitoring social determinants of health as an integral element of SDGs need to be established at all levels of functioning to achieve health equity.

Abbreviations

AB-HWCs: Ayushman Bharat Health and Wellness Centres

CSDH: Commission on Social Determinants of Health

GDP: Gross Domestic Product

SDH: Social determinants of health

IMR: Infant Mortality Rate

MMR: Maternal Mortality Ratio

MGNREGA: Mahatma Gandhi National Rural Employment Guarantee Act

NEP: New education policy

NFHS: National Family Health Surveys

Supporting information: None

Ethical Considerations: Not applicable

Acknowledgments: None

Funding: This research received no specific grant from any funding agency in the public, commercial, or not-for-profit sectors.

Author contribution statement: All authors (MK, VA, IM, SK, R, AP, RK) contributed equally and attest they meet the ICMJE criteria for authorship and gave final approval for submission.

Data availability statement: Data included is referenced in article.

Additional information: No additional information is available for this paper.

Declaration of competing interest: The authors declared no potential conflicts of interest with respect to the research, authorship, and/or publication of this article.

Clinical Trial: Not applicable

Consent for publication: Note applicable

References

[1] WHO. Social determinants of health. [Internet]. [cited 2024 Aug 4]. Available from: [Article][Crossref][PubMed][Google Scholar]

[2] Marmot M, Friel S, Bell R, Houweling TA, Taylor S. Closing the gap in a generation: health equity through action on the social determinants of health [Internet]. Geneva: World Health Organisation; 2008. [cited 2024 Mar 21]. Available from: [Article][Crossref][PubMed][Google Scholar]

[3] Freudenberg N. Integrating Social, Political and Commercial Determinants of Health Frameworks to Advance Public Health in the twenty-first Century. Int J Health Serv Plan Adm Eval. 2022. [Crossref][PubMed][Google Scholar]

[4] World Health Organization. Rio Political Declaration on Social Determinants of Health 2011. [Internet]. [cited 2024 Mar 21]. Available from: [Article][Crossref][PubMed][Google Scholar]

[5] Ortiz-Ospina E, Roser M. Global Health. Our World Data, 2024 [Internet]. [cited 2024 May 4]. Available from: [Article][Crossref][PubMed][Google Scholar]

[6] Brown AF, Ma GX, Miranda J, et al. Structural Interventions to Reduce and Eliminate Health Disparities. Am J Public Health. 2019;109(Suppl 1):S72–8. [Crossref][PubMed][Google Scholar]

[7] Ravindran TKS, Gaitonde R. Health inequities in India: a synthesis of recent evidence [Internet]. Singapore: Springer; 2018. [cited 2023 Oct 4]. Available from: [Article][Crossref][PubMed][Google Scholar]

[8] Cowling K, Dandona R, Dandona L. Social determinants of health in India: progress and inequities across states. Int J Equity Health. 2014;13:88. [Crossref][PubMed][Google Scholar]

[9] Nambiar D, Muralidharan A, editors. The Social Determinants of Health in India [Internet]. Singapore: Springer; 2017. [cited 2024 Jul 17]. Available from: [Article][Crossref][PubMed][Google Scholar]

[10] Constitution of India. New Delhi: Ministry of Law and Justice, (Legislative Department), Government of India. [Internet]. [cited 2024 May 4]. Available from: [Article][Crossref][PubMed][Google Scholar]

[11] National Health Survey, India. Indian Institute of Population Sciences, Mumbai. [Internet]. [cited 2024 May 4]. Available from: [Article][Crossref][PubMed][Google Scholar]

[12] National Sample Survey. Household Consumption Expenditure Survey, 2022-23 Fact Sheet [Internet]. New Delhi: Ministry of Statistics and Programme Implementation, Government of India [Internet]. [cited 2024 May 4]. Available from: [Article][Crossref][PubMed][Google Scholar]

[13] Registrar General of India. Sample Registration System - Abridged Life Table, Office of Registrar General & Census Commissioner, Ministry of Home Affairs, Government of India, New Delhi, 2022. [Internet]. [cited 2023 Oct 9]. Available from: [Article][Crossref][PubMed][Google Scholar]

[14] Economic Survey. Ministry of Finance, Government of India, New Delhi. [Internet]. [cited 2024 Jul 22]. Available from: [Article][Crossref][PubMed][Google Scholar]

[15] Kumar S. A trend of Increased and broadened electoral participation. In: Kumar S (ed) Elections in India. London: Routledge India; 2021. [Crossref][PubMed][Google Scholar]

[16] Farooqui A. Political representation of a minority: Muslim representation in contemporary India. India Rev. 2020;19(2):153–75. [Crossref][PubMed][Google Scholar]

[17] Sivaramakrishnan KC. Local Government [Internet]. In: Choudhry S, Khosla M, Bhanu Mehta P, editors. The Oxford Handbook of the Indian Constitution; Oxford University Press; 2016 [cited 2024 May 5]. Available from: [Article][Crossref][PubMed][Google Scholar]

[18] Ehmke E. India’s Mahatma Gandhi National Rural Employment Act: Assessing the quality of access and adequacy of benefits in MGNREGS public works. Int Soc Secur Rev. 2016;69(2):3–27. [Crossref][PubMed][Google Scholar]

[19] Garg S, Laskar AR. Community-Based Monitoring: Key to Success of National Health Programs. Indian J Community Med. 2010;35(2):214–6. [Crossref][PubMed][Google Scholar]

[20] Right to Information: A Citizens Gateway. Government of India, Ministry of Personnel and Training, New Delhi. [Internet]. [cited 2024 May 5]. Available from: [Article][Crossref][PubMed][Google Scholar]

[21] Nandraj S. Regulating Healthcare Establishments: The Case of the Clinical Establishment Act, 2010. [Internet]. In: Samiran Nundy, Keshav Desiraju & and Sanjay Nagral (ed) Healer or Predator? Oxford University Press; 2018 [cited 2024 May 5]. Available from: [Article][Crossref][PubMed][Google Scholar]

[22] National Policy For The Empowerment Of Women. 2001. [Internet]. [cited 2024 Dec 23]. Available from: [Article][Crossref][PubMed][Google Scholar]

[23] Kasliwal R. The Status of Gender Budgeting in India [Internet]. Account; Initiat Responsive Gov 2023. [cited 2024 Dec 23]. Available from: [Article][Crossref][PubMed][Google Scholar]

[24] Kapoor M, Shamika D. The Road to Inclusive Democracy: Measuring the Political Participation of Women in India (1951-2019) [Internet]. Obs Res Found 2023. [cited 2024 Mar 24]. Available from: [Article][Crossref][PubMed][Google Scholar]

[25] Network LI. President Grants Approval to 106th Constitutional Amendment Act Enabling Women’s Reservation in Lok Sabha & State Assemblies [Internet]. Law Insid 2024. [cited 2024 May 5]. Available from: [Article][Crossref][PubMed][Google Scholar]

[26] Sircar A. India New Land Reform Policy. Landesa 2013 [Internet]. [cited 2024 May 5]. Available from: [Article][Crossref][PubMed][Google Scholar]

[27] World’s largest anti-poverty scheme MGNREGA cut poverty, empowered women, but reach limited 2015. [Internet]. Financial Express. [cited 2024 May 5]. Available from: [Article][Crossref][PubMed][Google Scholar]

[28] Subramanian S. The Household Consumption Expenditure Survey 2022-23: What the ‘Fact Sheet’ Suggests about Welfare, Inequality, and Poverty in India. 2024 [Internet]. [cited 2024 Apr 6]. Available from: [Article][Crossref][PubMed][Google Scholar]

[29] Das P, Ghosh S, Paria B. Multidimensional poverty in India: patterns of reduction across population subgroups and geographical locations during 2005–06 and 2019–21. GeoJournal. 2023;88(4):3851–70. [Crossref][PubMed][Google Scholar]

[30] India GDP. Worldometer. [Internet]. [cited 2024 May 5]. Available from: [Article][Crossref][PubMed][Google Scholar]

[31] Bharti NK, Chancel L, Thomas P, Somanchi A. Income and Wealth Inequality in India, 1922-2023: The Rise of the Billionaire Raj. [Internet]. World Inequality Lab; 2024. Available from: [Article][Crossref][PubMed][Google Scholar]

[32] Right to Education. Ministry of Education, Government of India, New Delhi. [Internet]. [cited 2024 May 6]. Available from: [Article][Crossref][PubMed][Google Scholar]

[33] Annual Status of Education Report (Rural), 2023: Beyond Basics (Provisional). [Internet]. New Delhi: ASCER Center. 2024. Available from: [Article][Crossref][PubMed][Google Scholar]

[34] Pathania R. Literacy in India: Progress and Inequality [Internet]. 2020. [cited 2024 Mar 24]. Available from: [Article][Crossref][PubMed][Google Scholar]

[35] National Education Policy, 2020. Ministry of Human Resource Develoment, Govt of India, New Delhi. [Internet]. [cited 2024 May 6]. Available from: [Article][Crossref][PubMed][Google Scholar]

[36] Jafar K, Ananthpur K, Venkatachalam L. Digital divide and access to online education: new evidence from Tamil Nadu, India. J Soc Econ Dev. 2023;1–21. [Crossref][PubMed][Google Scholar]

[37] Skill India Annual Report 2022-23. Ministry of Skill Development and Entrepreneurship, Govt of India, New Delhi. [Internet]. [cited 2024 May 6]. Available from: [Article][Crossref][PubMed][Google Scholar]

[38] Pradhan Mantri Awas Yojana. Ministry of Housing and Urban Affairs, Government of India, New Delhi. [Internet]. [cited 2024 May 6]. Available from: [Article][Crossref][PubMed][Google Scholar]

[39] The National Right to Homestead Bill, 2013 [Internet]. In: The Legal Right to Housing in India. Cambridge: Cambridge University Press; 2019. [cited 2024 May 6]; page 198–207. Available from: [Article][Crossref][PubMed][Google Scholar]

[40] Swachh Bharat Abhiyan. Prime Minister of India. [Internet]. [cited 2024 May 6]. Available from: [Article][Crossref][PubMed][Google Scholar]

[41] Jal Jeevan Mission, Department of Drinking Water and Sanitation. Ministry of Jalshakti, Government of India, New Delhi. [Internet]. [cited 2024 May 6]. Available from: [Article][Crossref][PubMed][Google Scholar]

[42] Pradhan Mantri Ujjwala Yojana. National Portal of India. [Internet]. [cited 2024 Dec 23]. Available from: [Article][Crossref][PubMed][Google Scholar]

[43] National Air Quality Index. Central Pollution Control Board. Ministry of Environment, Forests and Climate Change, Government of India, New Delhi [Internet]. [cited 2024 May 6]. Available from: [Article][Crossref][PubMed][Google Scholar]

[44] National Mission for Sustainable Agriculture. Department of Agriculture and Farmers Welfare. Ministry of Agriculture and Farmers Welfare, Government of India, New Delhi [Internet]. [cited 2024 May 11]. Available from: [Article][Crossref][PubMed][Google Scholar]

[45] Agricultural Situation in India [Internet]. 2023. LXXIX. (03). [cited on 2024 May 11] Available from: [Article][Crossref][PubMed][Google Scholar]

[46] National Food Security Act (NFSA, 2013). Department of Food and Public Distribution. Government of India, New Delhi [Internet]. [cited 2024 May 6]. Available from: [Article][Crossref][PubMed][Google Scholar]

[47] Transforming Nutrition in India: Progress Report. Poshan Abhiyan. NITI Aayog, Government of India, New Delhi. 2018. [Crossref][PubMed][Google Scholar]

[48] National Health Policy. Ministry of Health and Family Welfare, Government of India, New Delhi. [Internet]. [cited 2024 May 11]. Available from: [Article][Crossref][PubMed][Google Scholar]

[49] National Rural Health Mission. Ministry of Health & Family Welfare, Government of India, New Delhi. [Internet]. [cited 2024 May 11]. Available from: [Article][Crossref][PubMed][Google Scholar]

[50] Ayushman Bharat - National Health Protection Mission. Ministry of Health & Family Welfare, Government of India, New Delhi. [Internet]. [cited 2024 May 11]. Available from: [Article][Crossref][PubMed][Google Scholar]

[51] Global Health Expenditure Database. World Health Organization, Geneva. [Internet]. [cited 2024 Jul 13]. Available from: [Article][Crossref][PubMed][Google Scholar]

[52] National Health Accounts 2019-20. Ministry of Health and Family Welfare, Govt of India, New Delhi. [Internet]. [cited 2024 May 11]. Available from: [Article][Crossref][PubMed][Google Scholar]

[53] Mukhopadhyay I, Bose M, Kadarpeta RSR. Exploring methods for improving out-of-pocket expenditure (OOPE) estimates for India [Internet]. 2023. [cited 2024 Jul 17]. Available from: [Article][Crossref][PubMed][Google Scholar]

[54] Kumari M, Mohanty SK. Caste, religion and regional differentials in life expectancy at birth in India: cross-sectional estimates from recent National Family Health Survey. BMJ Open. 2020;10(8):e035392. [Crossref][PubMed][Google Scholar]

[55] Das P, Ghosh S, Paria B. Multidimensional poverty in India: patterns of reduction across population subgroups and geographical locations during 2005–06 and 2019–21. GeoJournal. 2023;88(4):3851–70. [Crossref][PubMed][Google Scholar]

[56] Data Collection and Quality Concerns for National Family Health Surveys in India. Economic and Political Weekly [Internet]. 2024. [cited 2024 Dec 23]. Available from: [Article][Crossref][PubMed][Google Scholar]

[57] World Health Organization. Handbook on health inequality monitoring with a special focus on low- and middle-income countries [Internet]. Geneva: World Health Organization; 2013. [cited 2023 Oct 5]. Available from: [Article][Crossref][PubMed][Google Scholar]

[58] Barros A, Boutayeb A, Brown C, et al. Towards a global monitoring system for implementing the Rio Political Declaration on Social Determinants of Health: developing a core set of indicators for government action on the social determinants of health to improve health equity. Int J Equity Health. 2018;17(1):136. [Crossref][PubMed][Google Scholar]

Disclaimer / Publisher’s NoteThe statements, opinions and data contained in all publications are solely those of the individual author(s) and contributor(s) and not of Journals and/or the editor(s). Journals and/or the editor(s) disclaim responsibility for any injury to people or property resulting from any ideas, methods, instructions or products referred to in the content.